By the time the report arrives, the moment has passed.
The monthly report eats days
Pulling numbers out of files and systems takes days of work, and when it is ready, it describes the past.
Every file tells a different story
Sales in one spreadsheet, costs in another system, and two versions of the same number. Which one is true?
Problems show up when it's late
Between reports, the business flies blind. The leaks grow in exactly that gap.
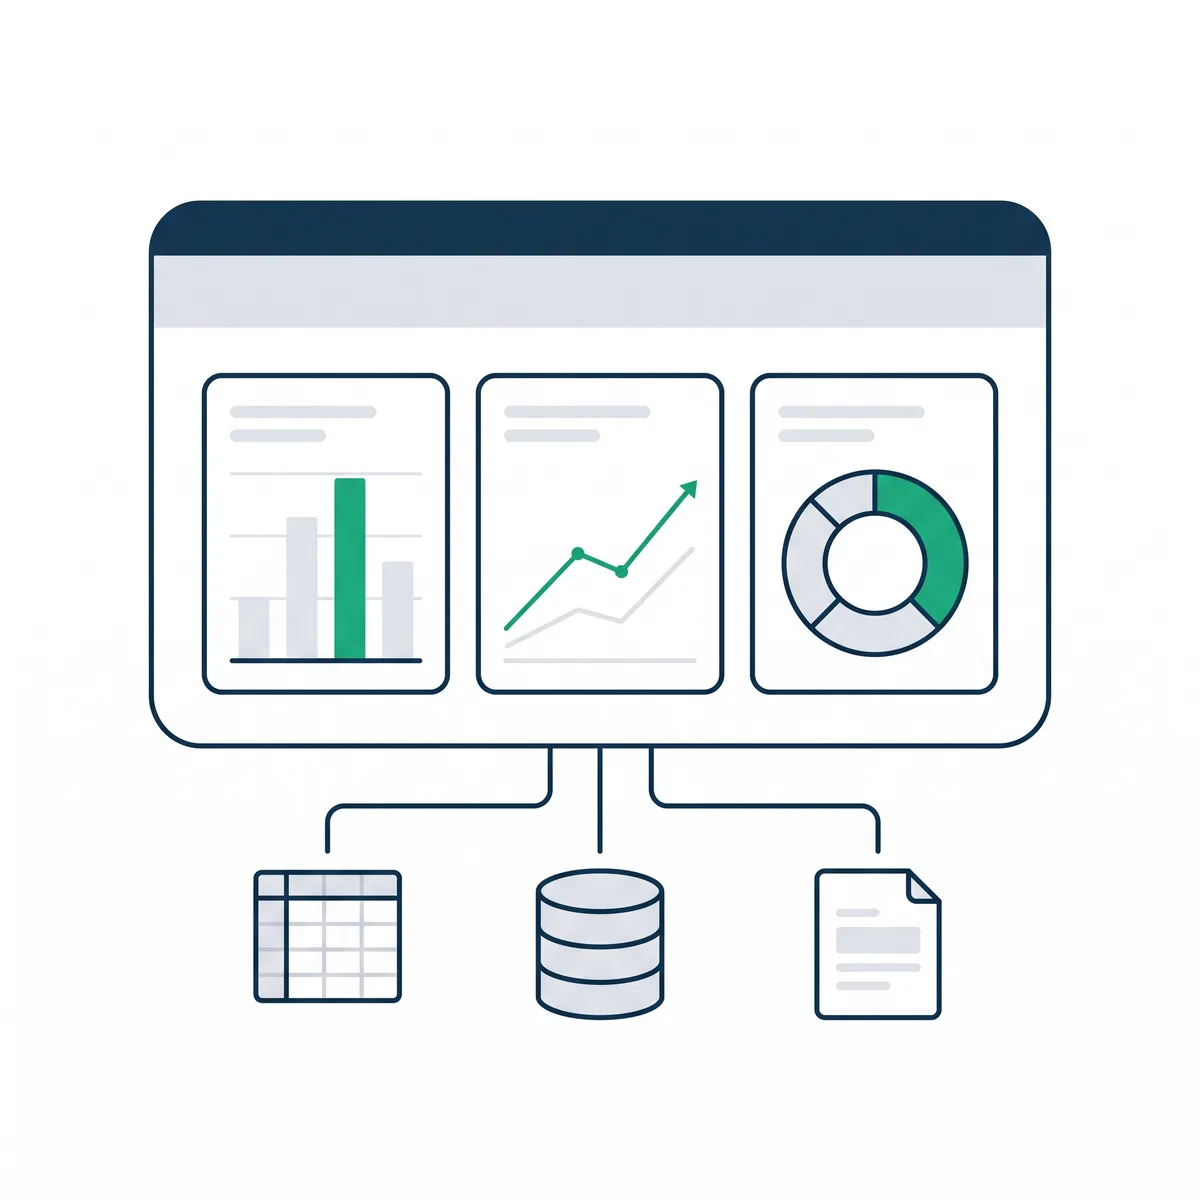
One live dashboard, built from your scattered sources.
We connect what runs your business: sales, costs, inventory, whatever it is, into one live dashboard. The right numbers, refreshing automatically, readable at a glance on your phone or a screen on the wall. This is the work we have done longest and know best.
Live view (coming soon)
What it does
The few KPIs that matter
We design the handful of numbers that actually steer your business, and put them on top.
Live, not last month
Data refreshes automatically. The dashboard shows today, not the report from three weeks ago.
All your sources in one place
Excel, your POS, your accounting, your systems: connected once, combined correctly.
Readable at a glance
Designed so a busy owner sees the state of the business in ten seconds, on any screen.
What you get
- A live dashboard connected to your real sources, refreshing itself.
- KPIs designed with you: what to measure, targets, and alarm lines.
- The data pipeline behind it: cleaned, combined, and documented.
- Access for the right people, on desktop, phone, or an office screen.
- A short training and honest documentation, so it lives without us.
How we work
Know
We learn how you steer the business today: which numbers you look at, which you distrust, and where they hide.
Insight
We define the KPIs worth steering by, and clean and combine the sources so the numbers agree with reality.
Vision
We design the view from above: what sits on top, what is one click deeper, and what stays out.
Act
We build the dashboard live, refine it against daily use, and stay until you check it instead of asking for reports.
Common questions
Which tools do you build on?+
Power BI most often, and other tools where they fit better. We choose by your systems, licenses, and budget, and say honestly which is right for your case.
Our data is a mess. Is that a problem?+
It is the normal starting point. Cleaning and structuring the data is part of the work, and that foundation stays with you whatever happens to the dashboard.
Can it update automatically?+
Yes. Wherever your systems allow a connection or an export, refresh is automatic. We tell you upfront if any source needs a manual step.
What does it cost to run afterwards?+
Usually only the tool's license, which we help you keep minimal. If you want ongoing tuning, a light retainer covers it; otherwise your team runs it alone.
Ready to see your business from above?
One free call. Tell us which numbers you wish you could see every morning, and we tell you honestly what it takes to get them on one screen.